
| Team | GP | W | L | PCT | HMR | STL | 1-PT | EEH | EES | |
| Alberta Peterman, J |
12 | 10 | 2 | 0.833 | 6-1 | 4-1 | 4-1 | 2-0 | 0-1 | |
| Manitoba Birchard, S |
12 | 10 | 2 | 0.833 | 4-1 | 5-1 | 2-0 | 0-0 | 0-0 | |
| British Columbia Van Osch, K |
12 | 8 | 4 | 0.667 | 5-2 | 3-2 | 1-2 | 0-0 | 0-0 | |
| Nova Scotia Dwyer, E |
12 | 7 | 5 | 0.583 | 4-2 | 3-3 | 1-1 | 1-0 | 0-0 | |
| Ontario Sinclair, J |
12 | 7 | 5 | 0.583 | 4-3 | 3-2 | 0-1 | 0-0 | 0-0 | |
| Northern Ontario Lilly, K |
12 | 6 | 6 | 0.500 | 2-5 | 3-1 | 1-2 | 0-0 | 0-0 | |
| Prince Edward Island Fullerton, S |
12 | 6 | 6 | 0.500 | 3-3 | 3-2 | 1-0 | 1-0 | 0-0 | |
| Saskatchewan Streifel, K |
12 | 6 | 6 | 0.500 | 2-3 | 3-3 | 3-0 | 0-0 | 0-0 | |
| New Brunswick Armstrong, J |
12 | 5 | 7 | 0.417 | 2-3 | 3-3 | 0-1 | 0-0 | 0-1 | |
| Quebec Perron, R |
12 | 4 | 8 | 0.333 | 1-3 | 2-5 | 0-1 | 0-0 | 0-0 | |
| Yukon Koltun, S |
12 | 4 | 8 | 0.333 | 1-3 | 3-4 | 1-2 | 0-0 | 0-0 | |
| Newfoundland / Labrador Trickett, E |
12 | 3 | 9 | 0.250 | 2-4 | 1-4 | 0-3 | 0-0 | 0-2 | |
| Northwest Territories Williams, T |
12 | 2 | 10 | 0.167 | 1-4 | 1-6 | 1-1 | 0-0 | 0-0 | |
GP = Games Played, W = Wins; L = Losses; PCT = Winning Percentage; HMR = Record with hammer to start game; STL = Record without hammer to start game; 1-PT = Record in games decided by 1 point; EE-H = Extra end record with hammer; EE-S = Extra end record without hammer. | ||||||||||
| |||||||||||||||||||||||||||||||||||||||||||||||||||||||||||||||||||||||||||||||||||||||||||||||||||||||||||||||||||||||||||||||||||||||||||||||||||||||||||||||||||||||||||||||||||||||||||||||||||||||||||||||||||||||||||||||||||||||||||||||||||||||||||||||||||||||||||||||||||||||||||||||||||||||||||||||||||||||||||||||||||||||||||||||||||||||||||||||||||||||||||||||||||||||||||||||||||||||||||||||||||||||||||||||||||||||||||||||||||||||||||||||||||||||||||||||||||||||||||||||||||||||||||||||||||||||||||||||||||||||||||||||||||||||||||||||||||||||||||||||||||||||||||||||||||||||||||||||||||||||||||||||||||||||||||||||||||||||||||||||||||||||||||||||||||||||||||||||||||||||||||||||||||||||||||||||||||||||||||||||||||||||||||||||||||||||||||||||||||||||||||||||||||||||||||||||||||||||||||||||||||||||||||||||||||||||||||||||||||||||||||||||||||||||||||||||||||||||||||||||||||||||||||||||||||||||||||||||||||||||||||||||||||||||||||||||||||||||||||||||||||||||||||||||||||||||||||||||||||||||
In the event of a discrepancy the draw posted at the Event is the Official Draw.
|
||||||||||||||||||||||||||||||||||||||||||||||||||||||||||||||||||||||||||||||||||||||||||||||||||||||||||||||||||||||||||||||||||||||||||||||||||||||||||||||||||||||||||||||||||||||||||||||||||
| Full Scoreboard | Play Fantasy Pick'em! | ||||||||||||||||||||||||||||||||||||||||||||||||||||||||||||||||||||||||||||||||||||||||||||||||||||||||||||||||||||||||||||||||||||||||||||||||||||||||||||||||||||||||||||||||||||||||||||||||||
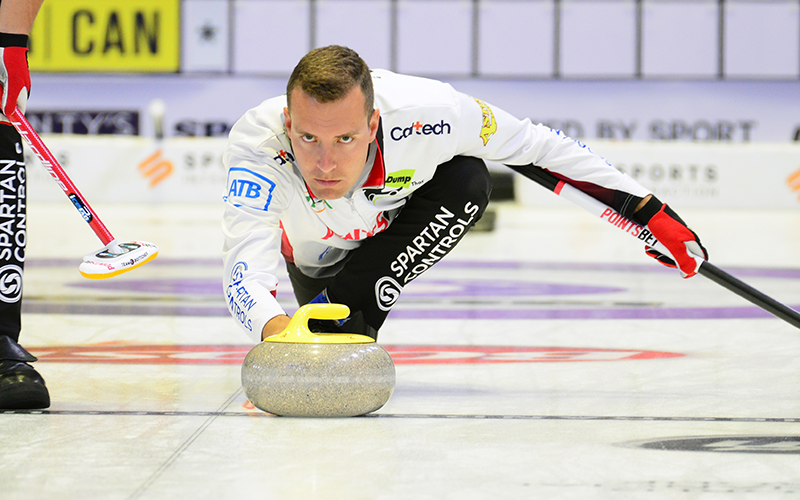
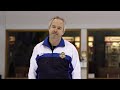
Brendan Bottcher (photo: Stan Fong) is moving on from now former teammates Marc Kennedy, Brett Gallant and Ben Hebert, announced Tuesday.


-
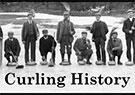 In the run up to Christmas Day, 1893, the Aberdeen Peoples's Journal offered a prize of one guinea for the best letter about curling! That's the invitation... (read more)
 -
 A quick break for the Memorial Day holiday and we're back with our guest and new USA Curling Womenâs National Team & Juniors Director Jessica Schultz.... (read more)
 -
 I am in week 3 of isolation/quarantine/home schooling and getting a little squirrel-y. Personal hygiene has become optional. The kids have watched the entire... (read more)
 -
 On today's World Curling Report...we recap Day 1 of the 2019 Canada Cup. (read more)
 -
On this week's podcast we focus on the Canada Cup with past champion Reid Carruthers (04:09), Adam Kingsbury - former coach of Team Homan and Team Jacobs (11:53)... (read more)